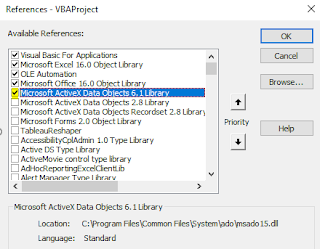
The easiest way to fetch data from databases to Excel is using the Get Data option available under the Data Tab, Excel creates a query using the ODBC connection and fetches the data without the hassle of coding. But coding makes the process more flexible and is very dynamic. Here goes the details... 1) Download and install the snowflake ODBC driver either 32 or 64 bit depending on your MS Office Installation & OS from the SnowFlake portal, available under the Help menu. 2) Create a DSN with the correct connection properties. 3) Add the below reference if required in the visual basic editor and also change the DSN name in the VBA code. VBA Code... '----------------------------------------------------------------------------------------------------------------------------------------- Sub VBA_SnowFlake_Connect() Dim sSQLQry As String Dim ReturnArray Dim Conn As ADODB.Connection Dim rs As ADODB.Recordset Dim DBPath As String, sconne...

